By standard medical guidelines, young and lean study subjects from a 2004 NEJM trial are in peak health. Functional assessments reveal impaired mitochondrial activity and profound insulin resistance.
What is metabolic health?
A simple question with many possible answers. Some define it as the absence of metabolic disease, using criteria like BMI < 25 kg/m^2, fasting glucose < 100 mg/dL, and hemoglobin A1C < 5.7%. Others may also consider waist circumference, cholesterol levels, or inflammatory markers, often providing “optimal” ranges.
You might also encounter definitions like “metabolic health is how well your body processes metabolites,” which can feel vague—hard to measure and harder to act upon.
For a definition of health beyond simply avoiding disease, the most useful framework I’ve seen comes from the WHO’s concept of functional ability. If we apply that to metabolism—defined as “the chemical processes that occur within a living organism to maintain life”—we get:
Metabolic health refers to the degree of functional capacity a person has to process nutrients, generate energy, and store energy in order to maintain life and adapt to stressors.
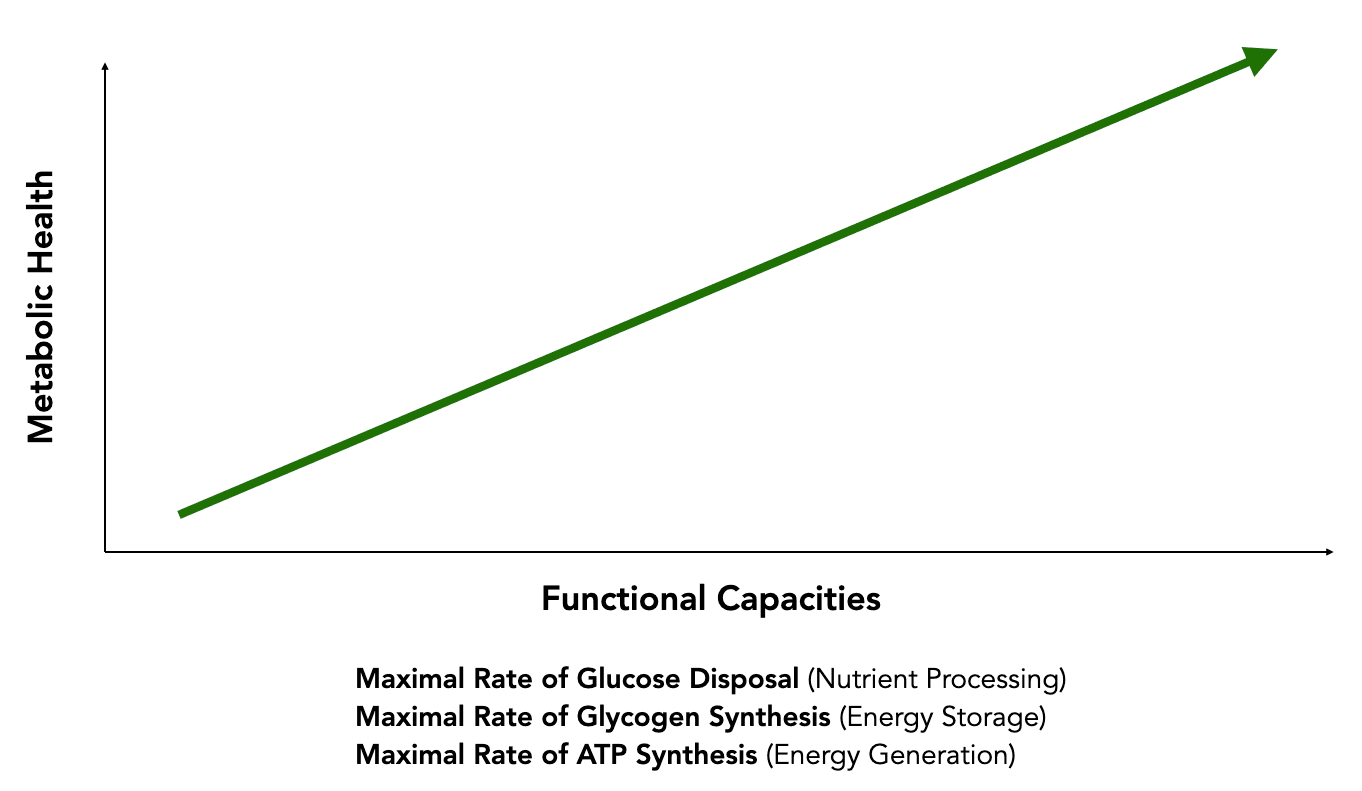
I hope you enjoy this overly simplistic graph showing a perfect correlation between high metabolic health and high functional capacities.
To illustrate differences in metabolic health as determined by legacy biomarker classifications and laboratory-assessed measures of functional capacity, let me take you through a 2004 paper in the NEJM that examined what features could explain differences in metabolic health between insulin resistant and insulin sensitive children of parents with Type 2 Diabetes (from the lab of the chair of my PhD committee).
But first, what is Insulin Resistance?
Insulin is a hormone with many actions on different target organs (muscles, fat, liver, brain, etc.). A key role of insulin is to drive glucose uptake into target organs, after binding to the insulin receptor. Insulin resistance refers to the concept that there is reduced activity of insulin action in response to a signal (like a rise in blood glucose). Thus, one manifestation of insulin resistance is the inability to lower blood glucose (or clear glucose) in response to elevated blood glucose (e.g. from food intake).
Insulin resistance is the best predictor of Type 2 Diabetes, and signs can be detected well before a person achieves a diagnosis. A landmark 1990 study in the Annals of Internal Medicine found that “One to two decades before type II diabetes is diagnosed, reduced glucose clearance is already present.” Insulin resistance is typically measured in the lab with functional tests, that I’ll describe below.
So now, back to the story.
Young, Normal A1C, Normal BMI— whats the catch?
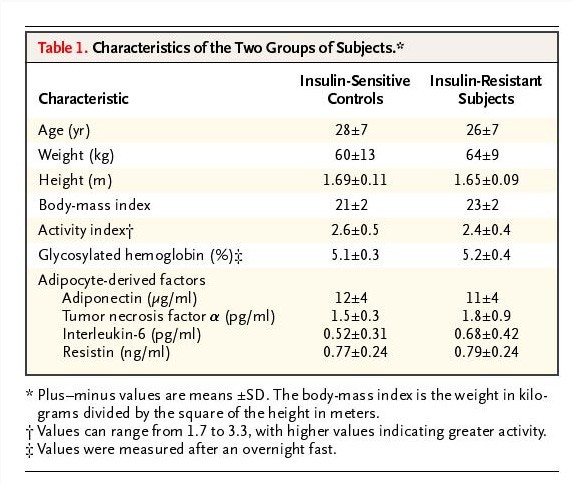
“Healthy” young people we’re recruited to understand the mechanisms underlying insulin resistance. Here’s what the authors selected for to recruit their participants:
“All subjects…were prescreened to confirm that they were in excellent health, lean, nonsmoking, and taking no medications. A birth weight above 2.3 kg (5 lb) and a sedentary lifestyle were also required. Qualifying subjects underwent a three-hour oral glucose-tolerance test (with a 75-g oral glucose load), after which two subgroups of subjects were consecutively selected to identify extreme phenotypes for insulin resistance and increased insulin sensitivity.”
I am glad that activity was controlled for in this study, as one of the most potent modulators of insulin resistance/sensitivity is exercise. But otherwise, what you can see in these 20-30 year old (probably grad student) subjects with normal BMIs and excellent A1Cs shows nothing remarkable from traditional metrics, or even inflammatory markers. However things change when you take a deeper look.
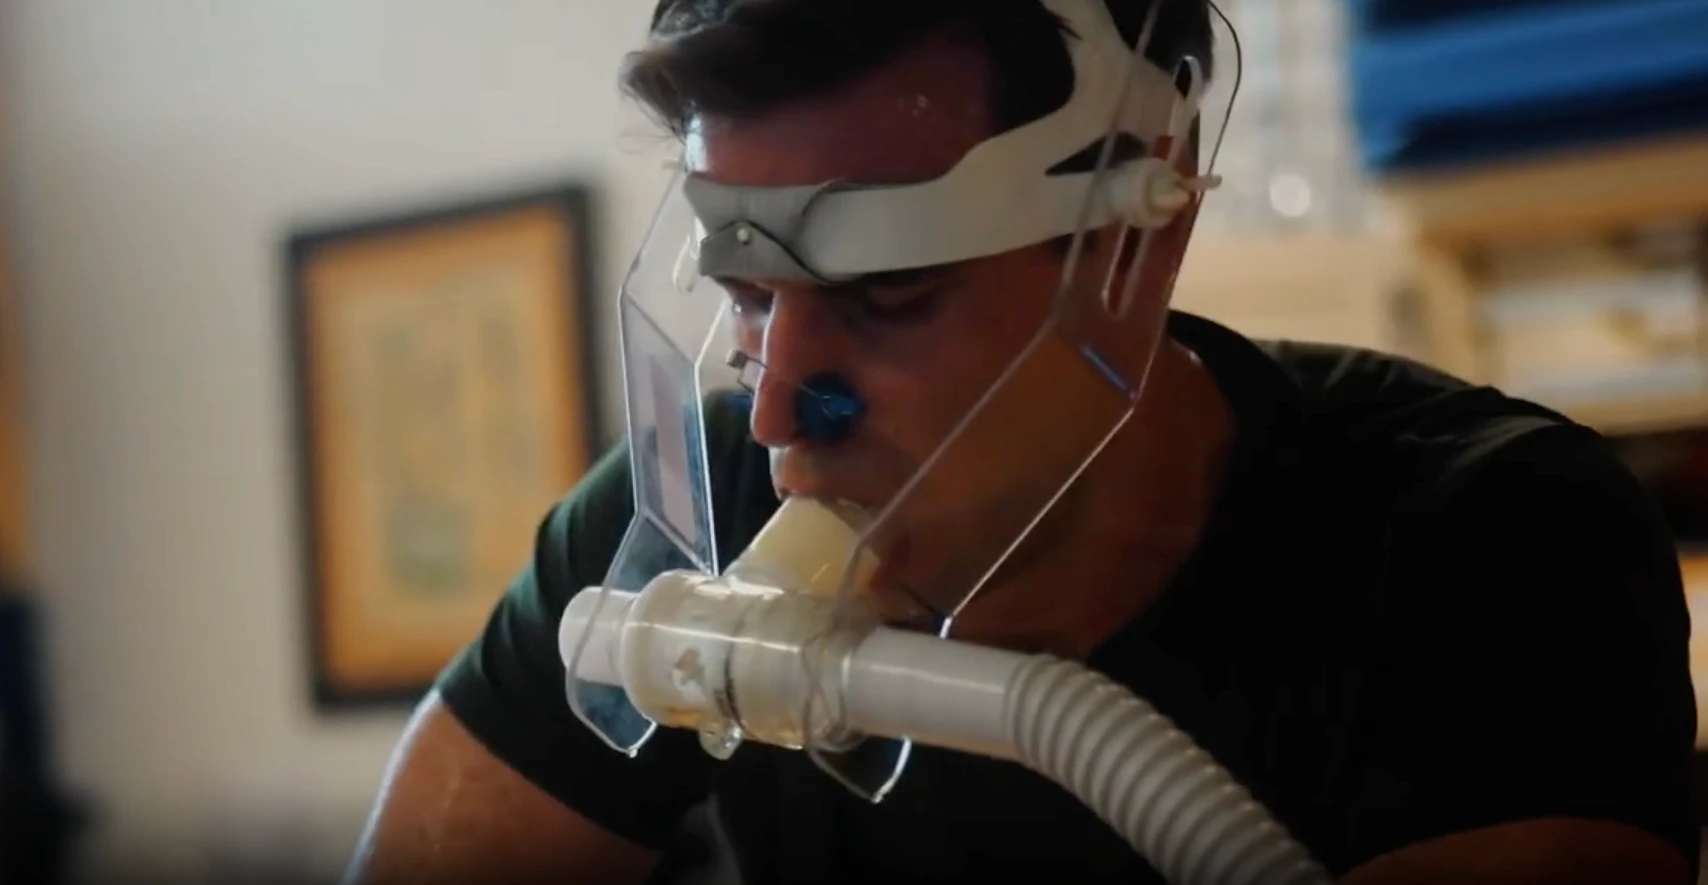
The first functional assessment: a 3 hour glucose tolerance test
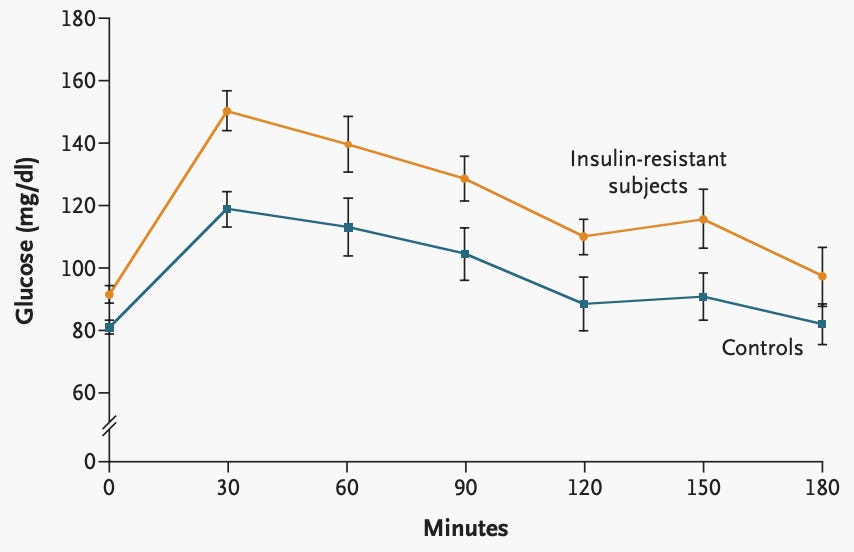
What you see in the graph is the plasma glucose in the blood of the subjects in response to 75g glucose load (~around a 20 oz bottle of Coca-Cola). The insulin-resistant subjects had a much higher peak glucose, and it remained elevated for the entire 3 hours. This type of study can be conducted at home with a continuous glucose monitor, for example, yet they aren’t quite as accurate as measuring blood glucose from an IV.
What this shows us is the 1990 definition of insulin resistance: reduced glucose clearance.
Now, since up to 90% of glucose uptake occurs by skeletal muscle, lets take a look at the measures of functional capacity in the muscles of these subjects as measured by a three-hour hyperinsulinemic–euglycemic clamp, and by a 31P magnetic resonance spectroscopy (MRS).
Reduced insulin stimulated glucose uptake as measured by hyperinsulinemic–euglycemic clamp
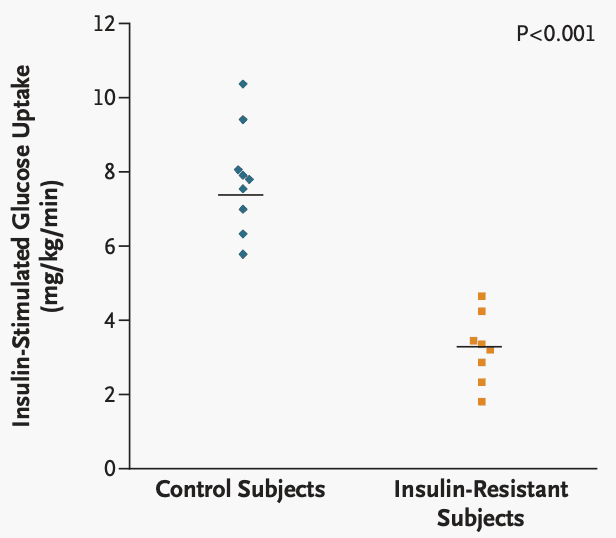
A hyperinsulinemic–euglycemic clamp aims to determine exactly how well the body (the majority driven by skeletal muscle) is able to use insulin to take glucose into the organs. To do this, the subject lays down in a bed with two IVs— one infusing insulin, the other infusing glucose. In response to a high infused insulin load (ie. “hyperinsulinemia”), the body begins to drive glucose into the subject’s organs.
With the other IV, the examiner aims to “clamp” blood glucose at a normal level (ie. “euglycemia”) by infusing glucose at a rate that replaces glucose as fast as it gets taken up.
The maximal rate of insulin-stimulated glucose uptake gives you the degree of metabolic functional capacity known as insulin sensitivity. The higher your insulin sensitivity, the better your metabolic health. Low insulin sensitivity is also known as insulin resistance.
In the figure above, you can see that the insulin-resistance subjects had >200% lower insulin-stimulated glucose uptake— very low functional capacity!
Now, what do the muscles do with that glucose?
In addition to storing the glucose as glycogen, the mitochondria (and glycolytic machinery in the cytoplasm) make the universal energy currency, ATP. The rate at which you are able to produce ATP is an excellent measure of functional capacity. If you are developing this measure from a wearable on every organ… please talk to me!
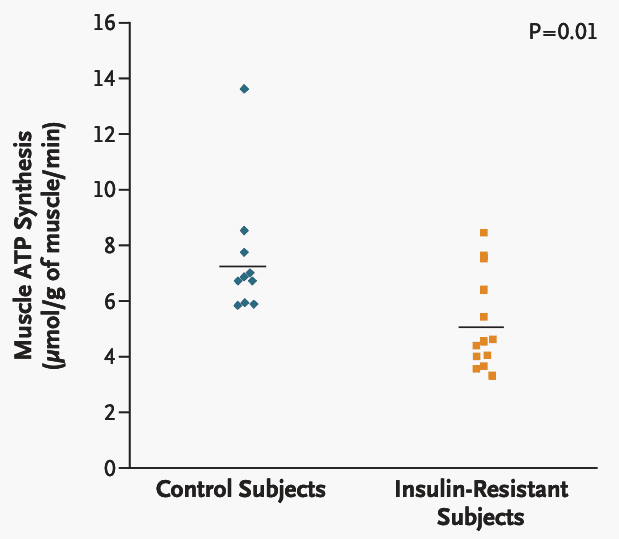
Once again, you see impaired capacity for muscle ATP synthesis in the insulin-resistant subjects. Despite having completely normal lab values, when you seek measures that tell you the functions of the body, the picture of impaired metabolic health becomes quite clear.
The Future of Metabolic Health Requires Better Measures and a Better Definition
Poor metabolic health is perhaps the largest health crisis of our lifetime. It underlies heart disease, diabetes, dementia, stroke, depression, and more. It is completely modifiable, and the metrics exist today. However, for improvements in metabolic health at population scale, we need to embrace systems level change, new technology, and a different different definition of health.
Current biomarkers of A1C, glucose, and BMI make prevention impossible— yet there are several well characterized measures of functional capacity that DO allow for early intervention
While HOMA-IR (a composite insulin resistance score of fasting glucose and insulin) is better than glucose or insulin alone, it isn’t able to give a good measure of functional capacity— Continuous glucose monitors, especially when controlled challenges are conducted, could yield significant insights
Omics (e.g. proteomics or metabolomics) have the ability to measure many molecules 10-50+ simultaneously that can provide an integrated measure that predicts glucose clearance, and can be much more powerful than 2-3 analyte composite score.
Metabolic health as spectrum of functional capacity (rather than binary category of normal vs. abnormal) is a necessary viewpoint shift to align diagnoses and interventions with metric that matter for human health.
Source: VO Health CEO Brooks Leitner's Substack: Read More Here

Written by
Brooks Leitner, MD PhD
Reading Time
11min